RESOURCE


Youth Organizing Financial Dashboard Template
In 2013 and 2014, Funders Collaborative on Youth Organizing (FCYO) partnered with Community Resource Exchange (CRE) to develop and launch the Financial Management Technical Assistance Program (FMTAP) for ten youth organizing groups from around the country. The goal: to help these critical organizations develop a deeper understanding of their own financial health and the best practices around nonprofit financial management. CRE provided a full range of services towards this end -- from financial assessment to large-group training to one-on-one implementation support.
In our work with the ten groups selected to be part of FMTAP, we stressed the value of using a financial dashboard as an effective way of giving staff leadership and the board the most critical information regarding the organization’s financial condition. At the time of the initiative, none of the ten organizations were using a financial dashboard – which was not surprising given how new a concept the dashboard is for many nonprofits. Several of the participating groups expressed an interest in the financial dashboard idea, and, as a result, we have created this basic financial dashboard template in partnership with FCYO.
This tool is designed to be a simple, straightforward dashboard to help your organization track basic aspects of its financial health over the course of a given year. Like any dashboard it is meant to give the reader an “at-a-glance” look at the organization’s financial health. It is not meant to replace the financial reports you generate each month. In fact, your financial reports will guide you in answering questions that emerge as you review your dashboard.
Two fundamental questions each nonprofit, regardless of size and complexity, must continuously answer are:
- From a financial standpoint how is our organization actually doing as compared to our annual budget?
- How much cash does my organization have on hand to fund its operations?
The first section of this dashboard is designed to answer these two questions in an easy-to-read format. The second section of this dashboard provides some additional items you may consider tracking. Of course, there are many more dashboard items related to 2 financial health – and other areas of organizational performance – that you can add to your dashboard as your organizational needs expand. For an excellent additional resource, here is a library of dashboard indicators developed by CompassPoint Nonprofit Services.
Step-by-Step Instructions
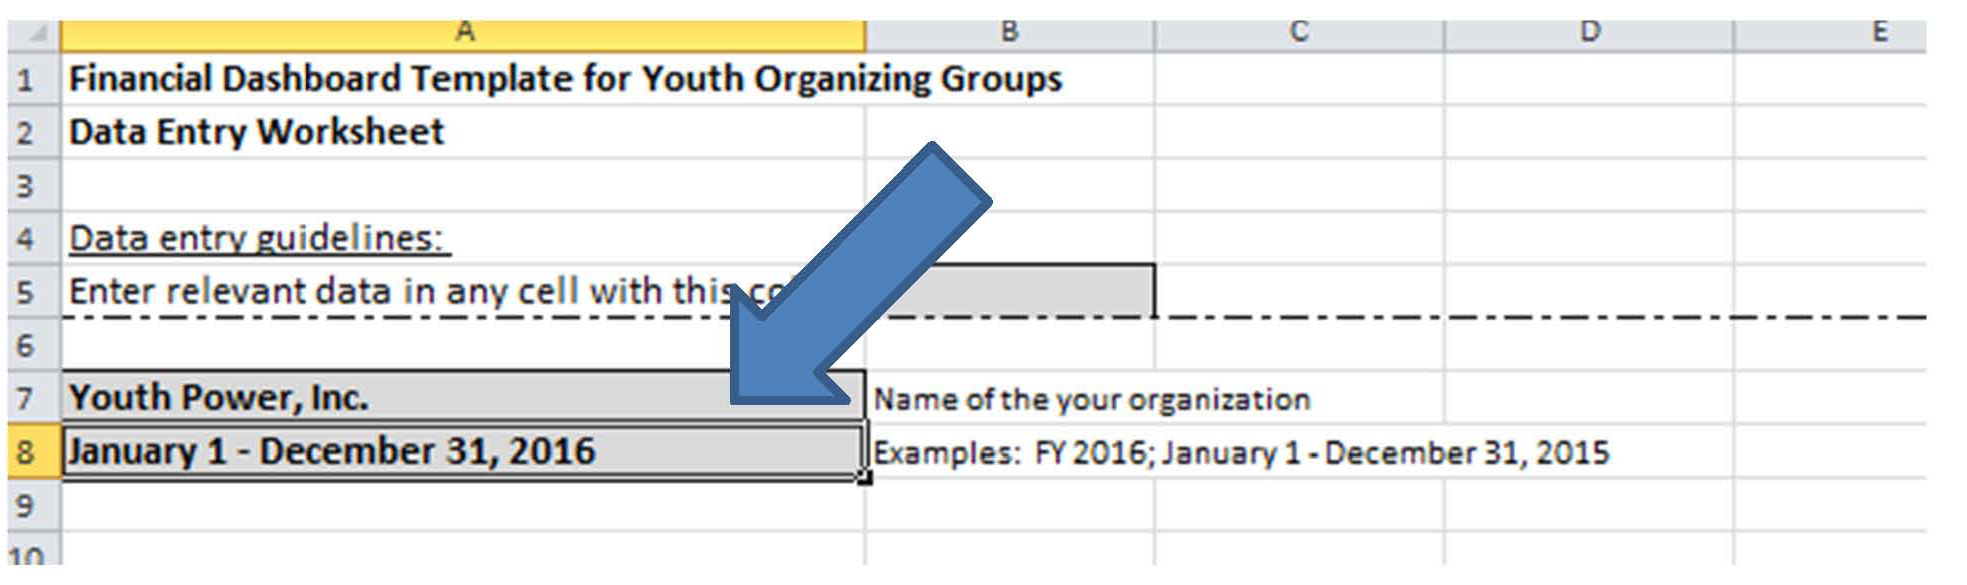
There are two separate spreadsheets in this workbook – one entitled “Dashboard” and one called “Worksheet.” You only need to enter data into the Worksheet tab; information automatically flows to the Dashboard tab. Moreover, within the Worksheet tab you should enter data only into the grey cells. Go to the Worksheet tab and take the following steps to make your financial dashboard operational:
- Step 1: Insert your organization’s name and your financial reporting year (e.g., a certain date range: “January 1 – December 31, 2016) at the top of the spreadsheet.
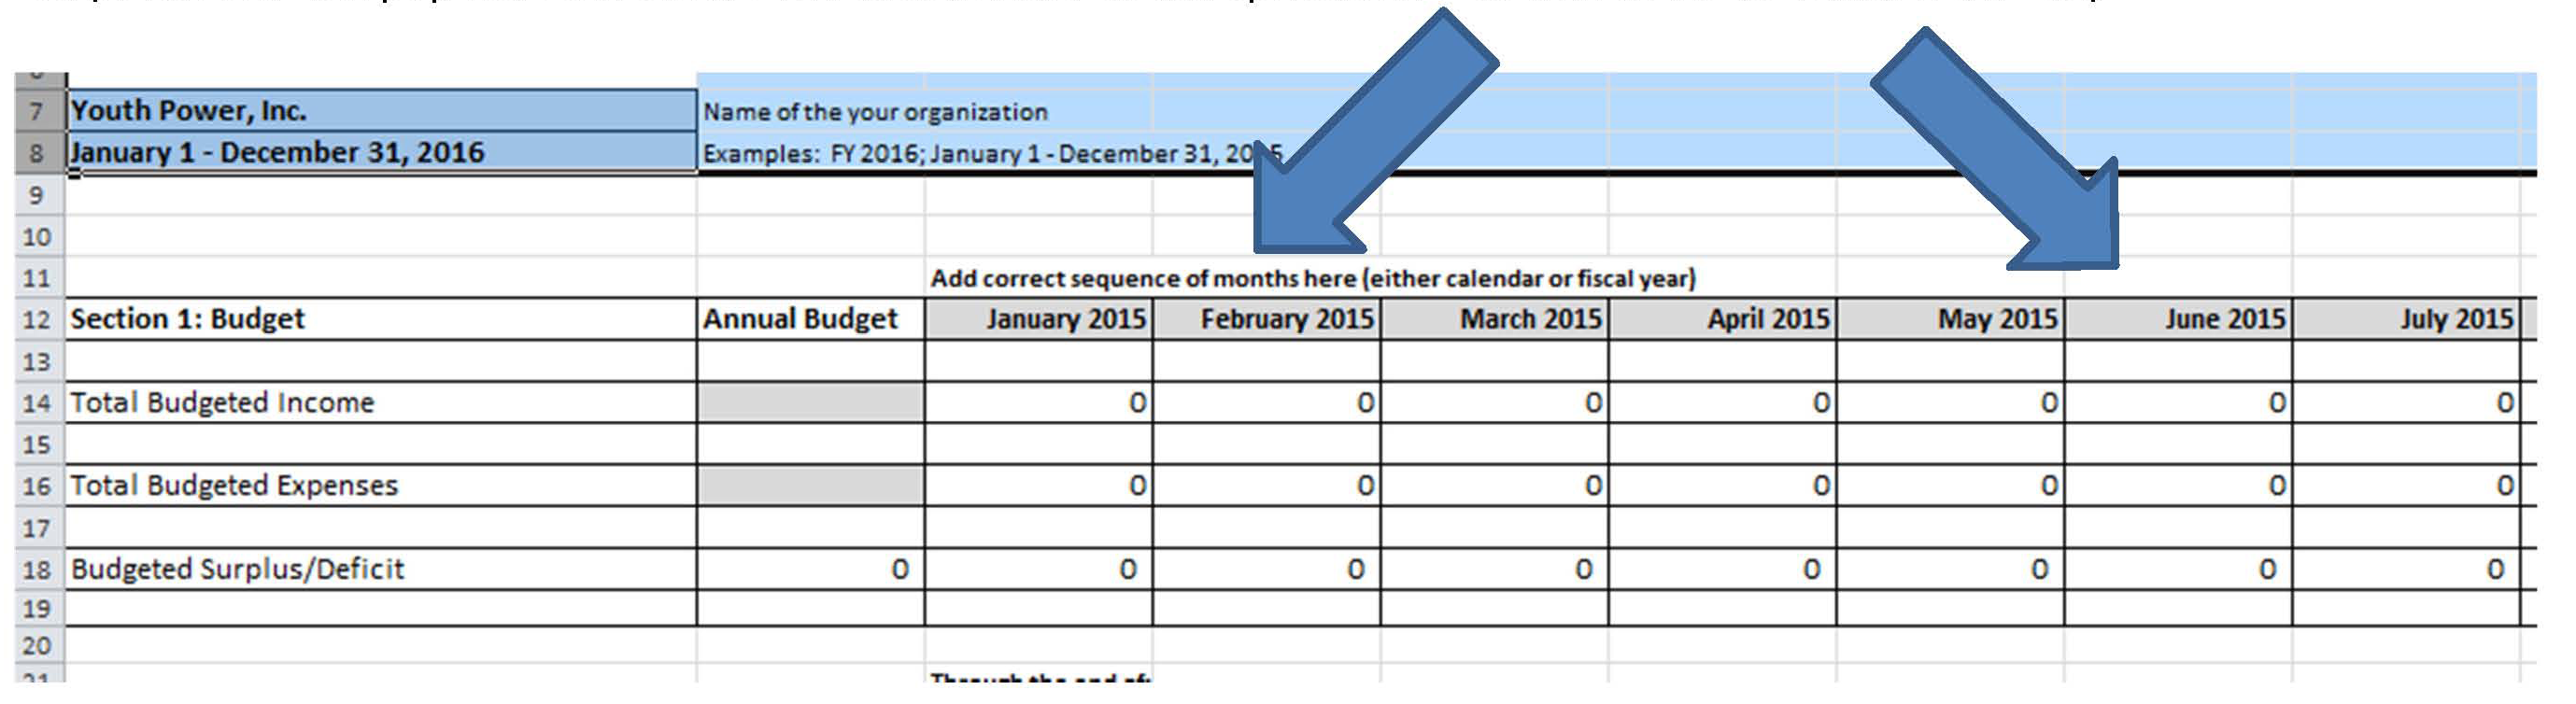
- Step 2: Manually enter the months that reflect the correct sequence of your reporting year (e.g., January 2015 and so on) to row 12. (Note: This will populate the other rows with months in this spreadsheet as well as on the Dashboard tab.)
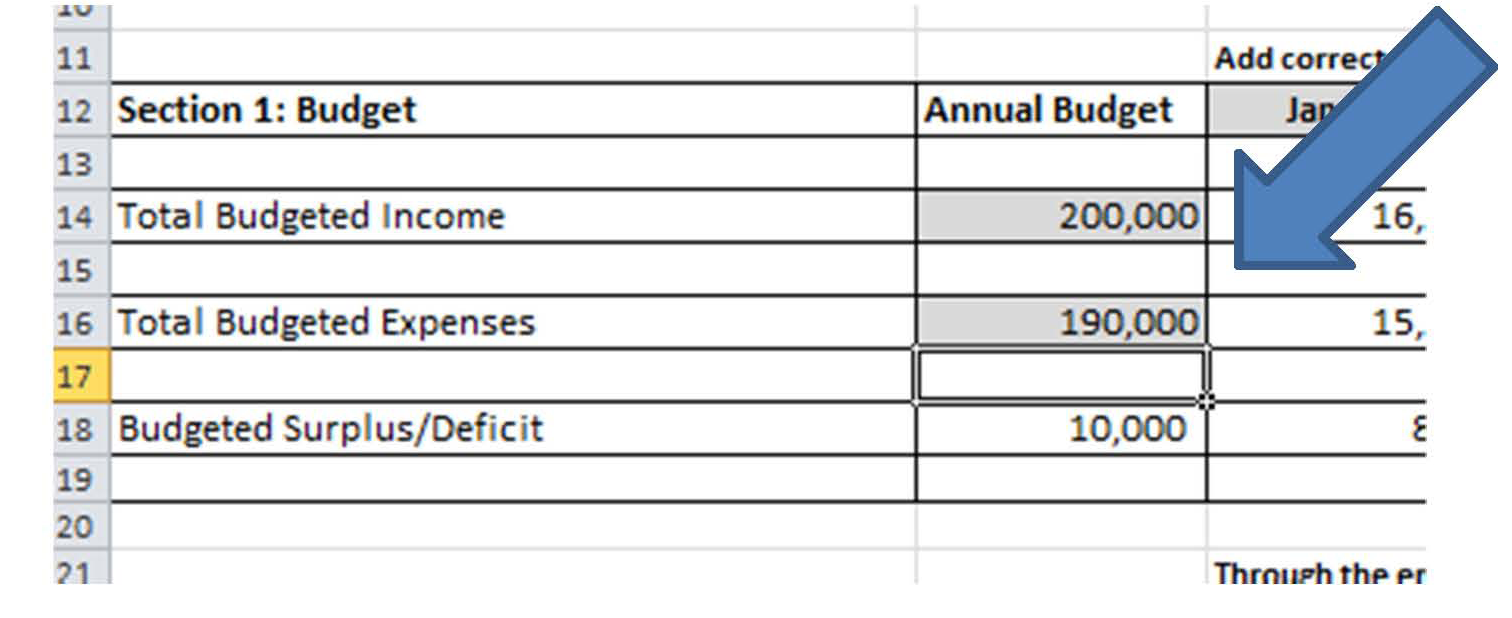
- Step 3: Manually enter the annual totals for your budgeted income and expenses. (The worksheet will automatically calculate your monthly budget totals.)
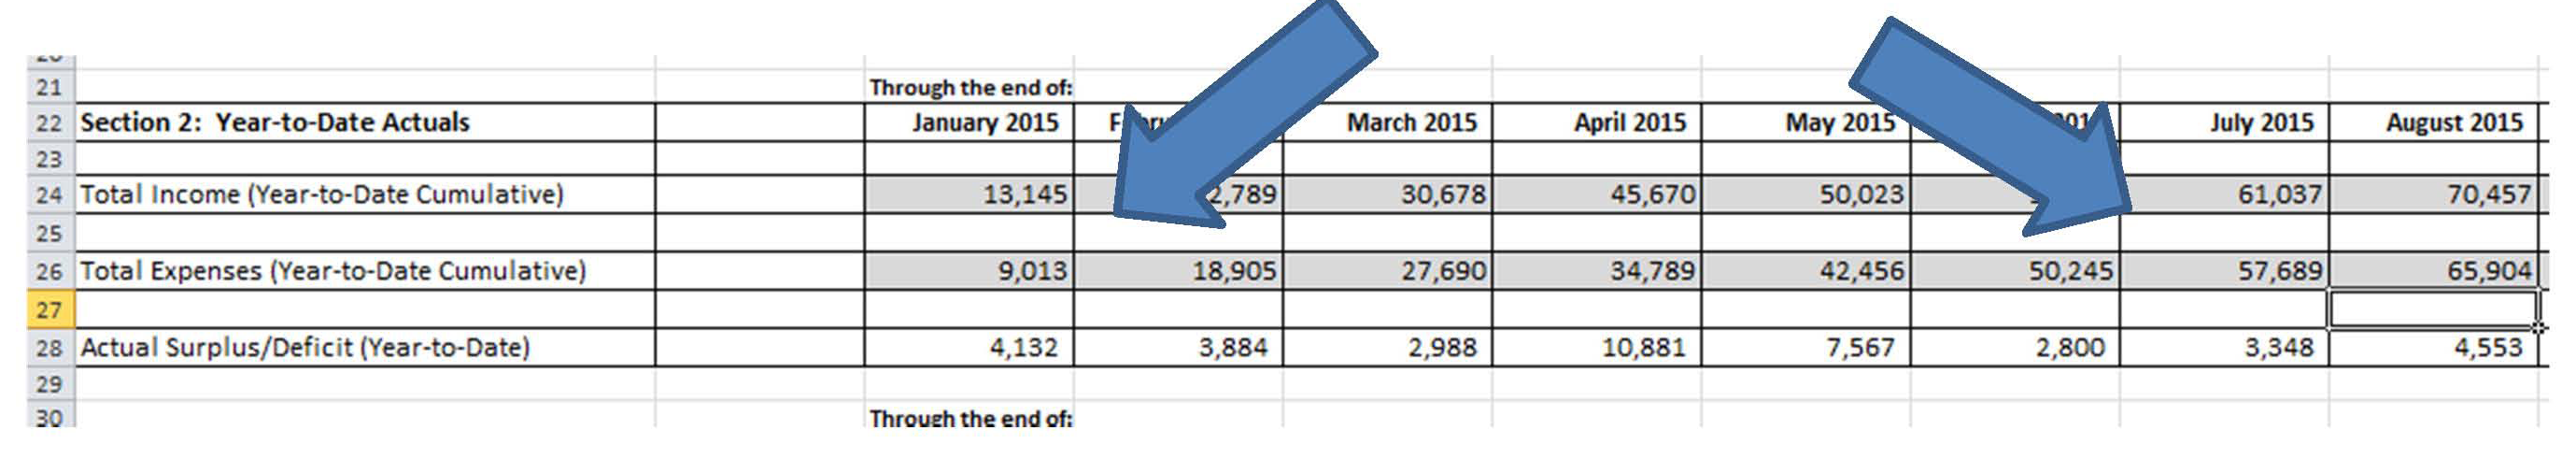
- Step 4: Add your actual expense and income totals (year to date) as the year progresses.
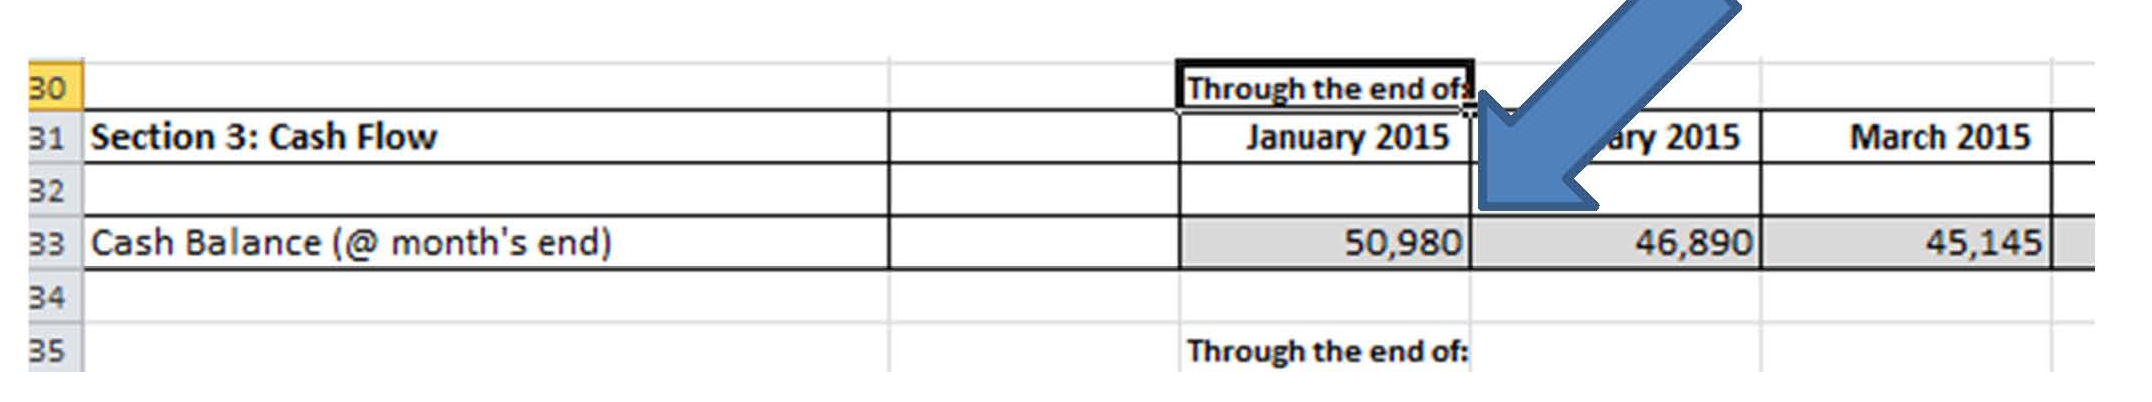
- Step 5: Enter your total cash reserves after the end of each month (i.e., what you have available for use in your bank account [s]).
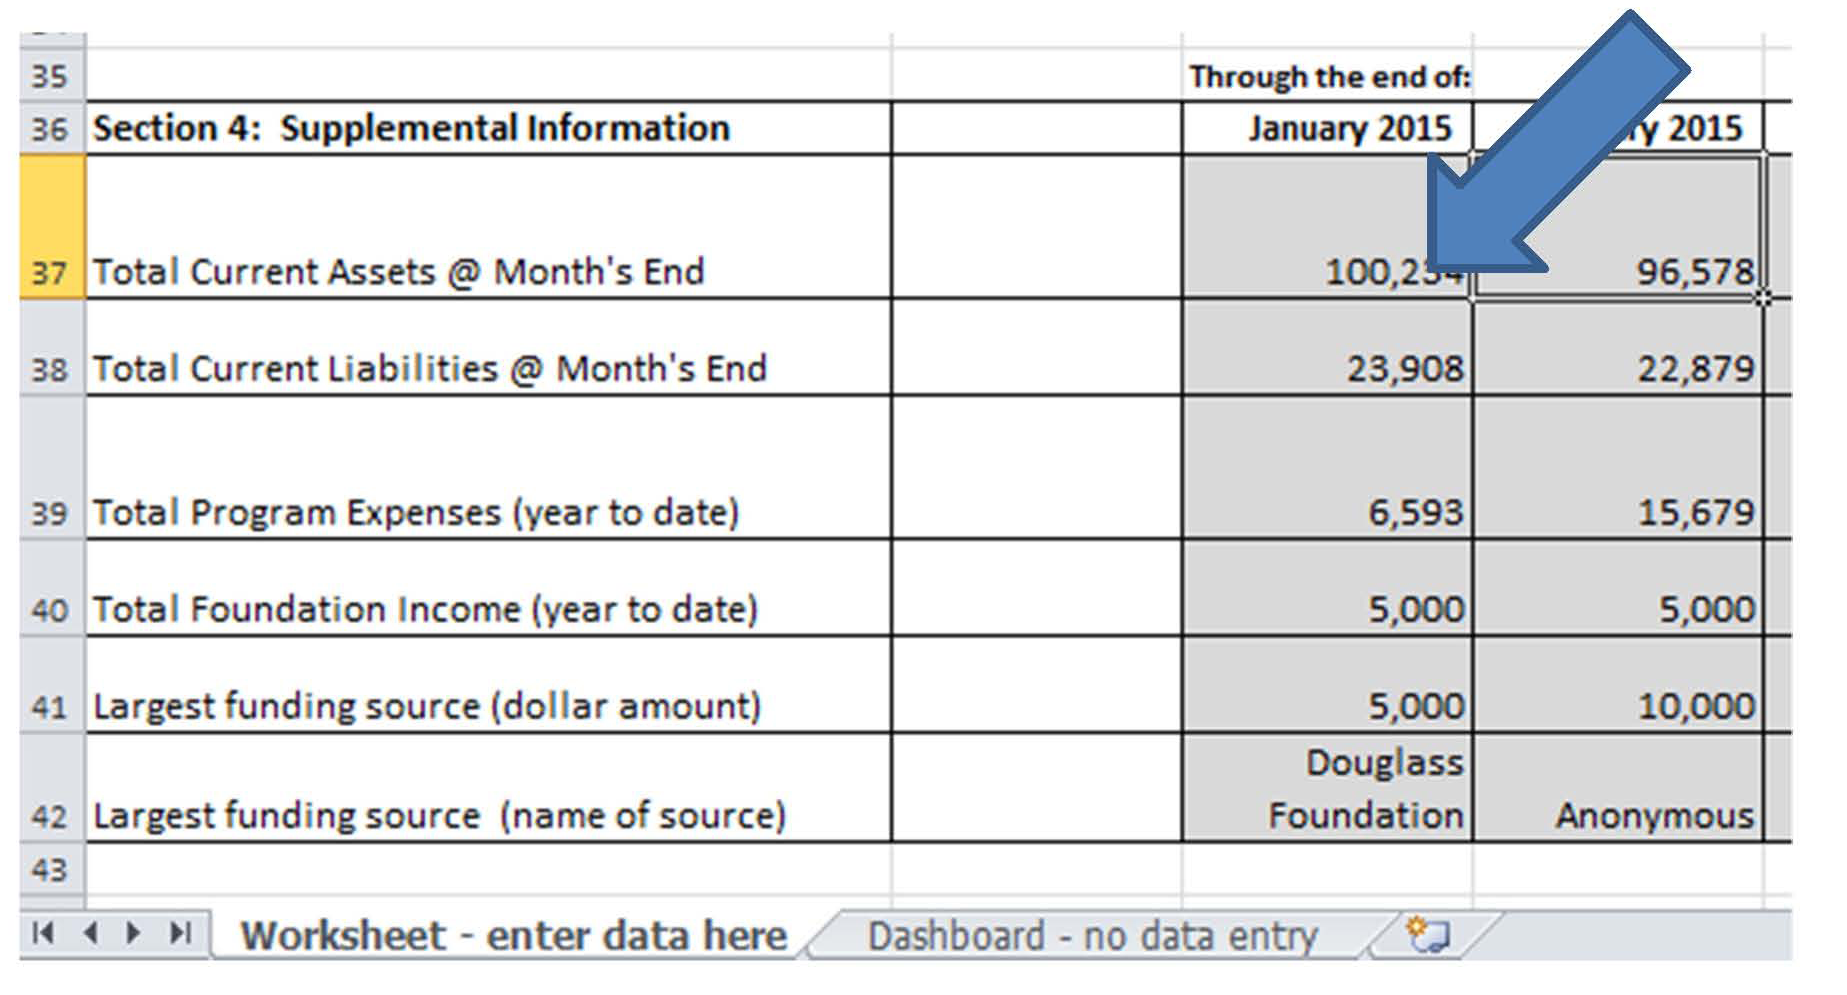
- Step 6 (Optional): Add the required information for any of the supplemental dashboard items (if you would like to use their corresponding indicators in the Dashboard spreadsheet). There are brief descriptions of some terms -- such as assets and liabilities – in the Worksheet tab.
Maintaining Your Dashboard
As the year progresses pay attention to how your actual financial “performance” (income received and expenses incurred) compares to your budget and how your organization’s “bottom line” is faring. Are you consistently running a surplus or deficit? Why? In terms of cash reserves, how close are you to the stated target amount of 3-6 months of operating expenses in the bank? What else are learning about organization’s cash flow, expense spending, and income diversity by tracking the indicators in the supplemental section? From a presentation standpoint you will just need to show the “Dashboard” tab, and, in addition, you may find it helpful to “hide” all columns except the current month. We hope this tool helps you as you keep your organization financially healthy and sound!